
Dubai: Ten countries are at highest risk of spreading the Novel Coronavirus.
An extensive study by Germany’s Humboldt University and Robert Koch Institute computed a list of countries at risk of importing the virus after analyzing air traffic patterns connecting 4,000 airports worldwide – with over 25,000 direct connections between them.
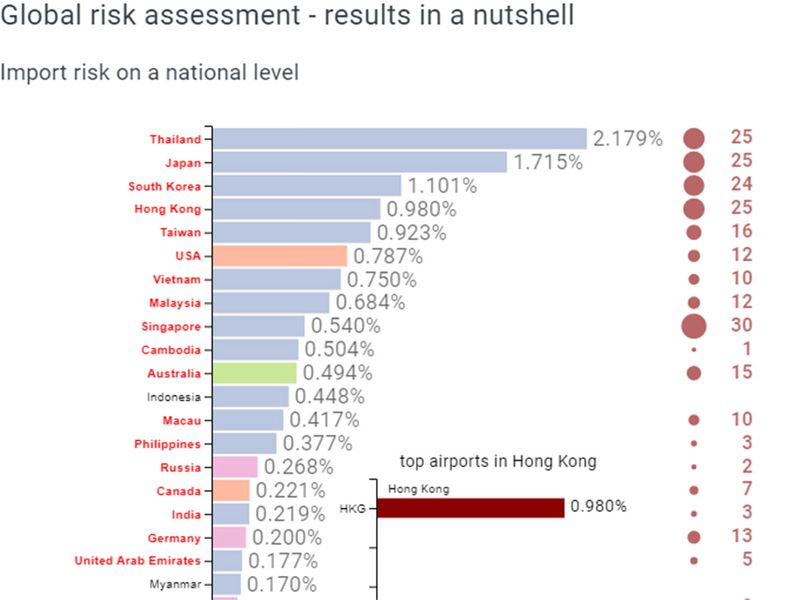
The model has been based on three factors - Relative import risk, Most probable spreading routes, Relative arrival time. According to the study, 'relative import risk' is the percentage of infected individuals who may be travelling from an affected area - in this case China.
Top on the list of countries most likely to 'import' the coronavirus is Thailand with a 'relative import risk' of 2.179 per cent. Next is Japan, with a relative risk of 1.715 per cent followed by South Korea – 1.101 per cent, Hong Kong – 0.980 per cent and Taiwan – 0.923 per cent.
UAE, India
India is among the top 20 countries likely at risk of importing the coronavirus (2019-nCoV).
Owing to the popularity and high connectivity of UAE's airports, which was used for the study, it is understandable why UAE featured on the top 20 list but the country's ‘relative import risk’ is low compared to rest of the countries featuring in the top tier.
The 'relative import risk' for UAE stood at a 0.177 per cent, lower than India which stands at 0.219 per cent.
The study ranked India in the 17th spot and the UAE in the 19th spot among a total of 30 countries at risk of importing the virus.
UAE’s Dubai airports had a localized relative import risk of 0.124%, Abu Dhabi at 0.050%, Sharjah – 0.002%. The Dubai Al Maktoum International posed no risk (0%) risk of importing the virus.
For India, New Delhi's Indira Gandhi International Airport had a localised relative import risk of 0.066 per cent, with Mumbai's Chhatrapati Shivaji Airport at 0.034 per cent and Kolkata's Netaji Subhash Chandra Bose Airport at 0.020 per cent. Other Indian airports in the list include Bengaluru, Chennai, Hyderabad and Kochi.
No definitive predictions
One of the scientists involved cautioned against using this model to make definitive predictions of any sort.
"This is not so much a tool for making quantitative predictions. Public health officials and policymakers have to develop an intuition because this virus is something unknown. Models can help you develop an intuition," Dirk Brockmann, who led the modeling team, was quoted in a report by Science Magazine, a highly-regarded peer-reviewed academic journal.
Computational model leading to the study results of countries at highest risk of importing the virus.
Methodology
"Going by air travel passenger numbers, we can estimate how likely the virus spreads to other areas. The busier a flight route, the more probable it has an infected passenger travelling this route. Using these probabilistic concepts, we calculate relative import risk to other airports," the study said.
“Using these probabilistic concepts, we calculate the relative import risk to other airports. When calculating the import risk, we also take into account connecting flights and travel routes that involve multiple destinations,” revealed the study.
In order to interpret the results presented on this site, it is important to understand the concept of relative import risk in the context of the 2019-n-CoV outbreak and global air transportation.
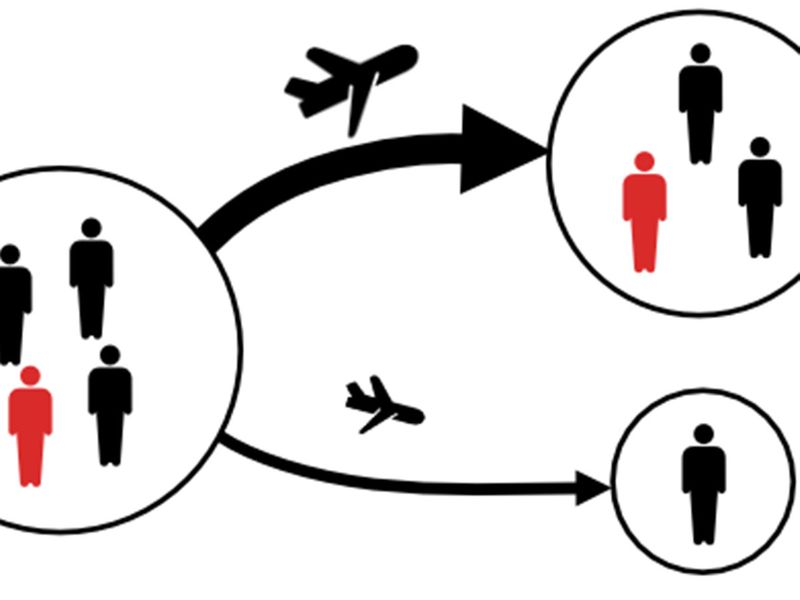
Definition of relative import risk
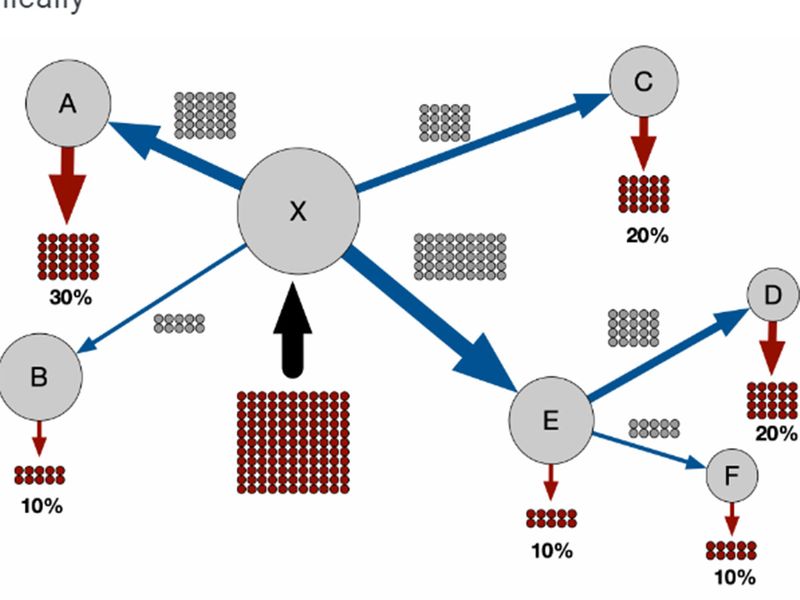
If an infected individual boards a plane at airport A in an affected region, the relative import risk P (B|A) at airport B quantifies the probability that airport B is the final destination for that individual (irrespective of non-direct travel routes).
Example
Say, a hypothetical 1000 infected individuals board planes at Hangzhou Airport. An import risk of 0.2 per cent in Germany means that, of those 1000 individuals, only 2 are expected to have Germany as their final destination.
Most probable spreading routes
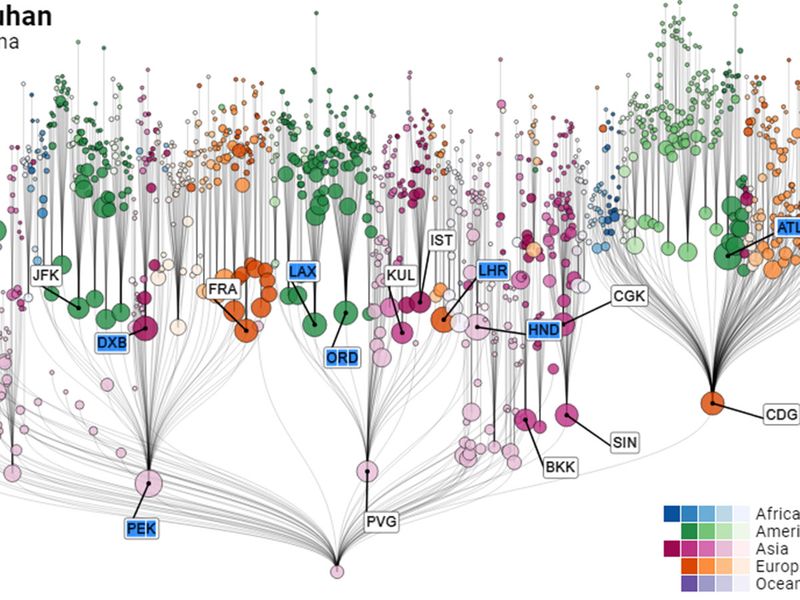
Given an outbreak location and an origin airport close to it, the model identifies the most probable spreading routes to all other airports in the network.
Even though passengers can take different routes to a final destination, in the worldwide air transportation network, global spreading patterns are dominated by the most probable paths. When viewed from the origin airport (the root node), these paths make up a shortest path tree that shows how the spreading process can reach all other airports in the network. These trees are important for identifying what airports play a pivotal role in distributing the spreading process throughout the network.
Data

Whenever an infectious disease poses the risk of spreading into a global pandemic, air transportation plays a crucial role. Modern air traffic connects every corner of our globe. However, this means that it also enables regionally confined outbreaks of infectious diseases to “jump” across country borders at an unprecedented rate.
Therefore, the core of the computational model is the worldwide air transporation network. This network has 3893 nodes (airports) that are connected by 51476 directed links (connections between airports). Each link is weighted by the traffic flux between nodes, i.e. the average number of passengers that travel that route per day.
Properties of the worldwide air transportation network (WAN)
The WAN's most prominent features are its structural complexity and its intrinsic heterogeneity, some of which can be quantified by network-theoretic methods. For example, airport size varies substantially in terms of the number of passengers that traverse each airport on a daily basis. Similarly, the degree of an airport (the number of other airports directly connected) is equally diverse.
The WAN has been analyzed in many publications and used in a variety of computational models for the spread of infectious diseases. Several properties of the network are summarized below.

The WAN exhibits strong heterogeneity – some airports are tiny, while others are huge international hubs. These distinctions become apparent when surveying the properties of airports in the network and observing the wide range of values. For example, the number of passengers per day (the flux) in some airports does not exceed 100, while other airports accommodate over 10000 people. Similarly, the number of flight connections emanating from an airport (the out degree) is approx. 13 on average, though some airports boast over 100.
As a result of heterogeneous networks like the WAN, the model is predominantly driven by only a small number of nodes – the big regional and international hub airports – while the majority of the nodes are virtually structurally trivial. For example, if the smallest half of airports the network were removed, only about 7 per cent of the total traffic would be lost.
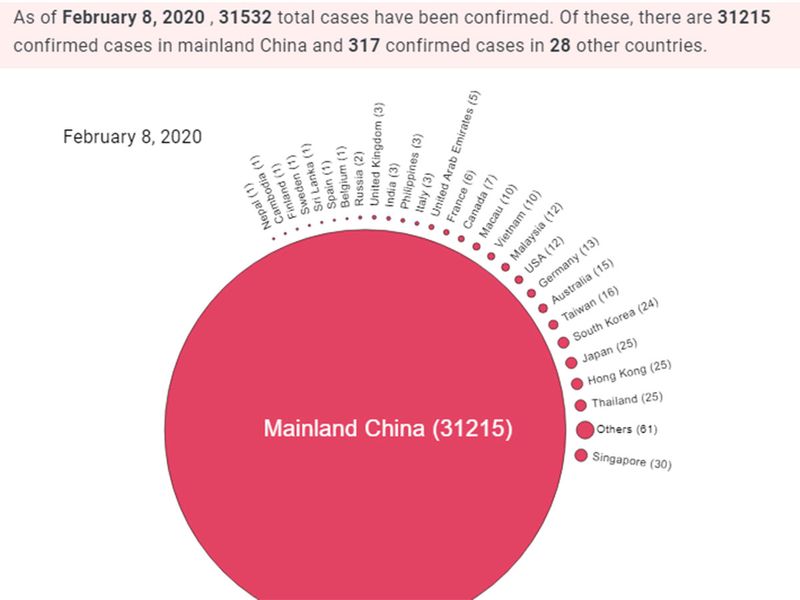
According to the study, as of February 9, the global number of infected are now more than 37,000 — the vast majority in mainland China. The current outbreak of the 2019-nCoV virus started in Wuhan City, Hubei Province, China.
While the first cases were reported as early as December 8, 2019, the outbreak gained global attention on December 31, 2019, when the World Health Organization (WHO) was alerted to “several cases of pneumonia” by an unknown virus.
The new virus was soon identified as a novel coronavirus and named 2019-nCOV. It belongs to the family of viruses that include the common cold and viruses such as SARS and MERS. On January 20, 2020, it was confirmed that the coronavirus can be transmitted between humans, greatly increasing the risk of a global spread.


